An investigation, not a dashboard
Walmart Marketplace is the third-party side of Walmart.com. Pricing Room is the internal platform where Walmart’s own agents configure and control the rules that decide whether a seller’s offer can be sold on the site.
- Role
- Senior Product Designer — discovery, information architecture, interaction design, prototyping, documentation, handoff and QA.
- Collaborators
- PM, Engineering, Data, SAM/Partner Support, Content Design and Design System (PX).
- North star
- An analyst should be able to say why an item came down, and fix it, without opening a second tool.
In 30 seconds
- 01 · Problem
- Support investigated unpublished offers across fragmented tools, often escalating to the pricing team.
- 02 · Decision
- Design the investigation, not a dashboard: the reason first, then the offers, the thresholds with their source, and the fix in the same page.
- 03 · Result
- Average resolution fell from 12 to 2 days; escalations fell from 27% to 19%, measured three months after the MVP. Targets were 1 day and below 10%.
The problem
A pricing rule unpublishes a reseller’s item on Walmart.com, and the chain that follows has four links. The seller looks in Seller Center, finds no reason, and contacts support. A SAM or a Partner Support agent investigates by hand across Pricing Room and several other internal platforms, where the same figure can appear twice with two values and none of them says which rule applied. Each analyst has their own route through those tools, so two people can reach two answers on the same item. When the evidence runs out — 27% of the time it did — the case goes to the pricing team, the only people who can read the rule at its source. Every link adds days, and the item is off the site for all of them.
A case, step by step
01 / 06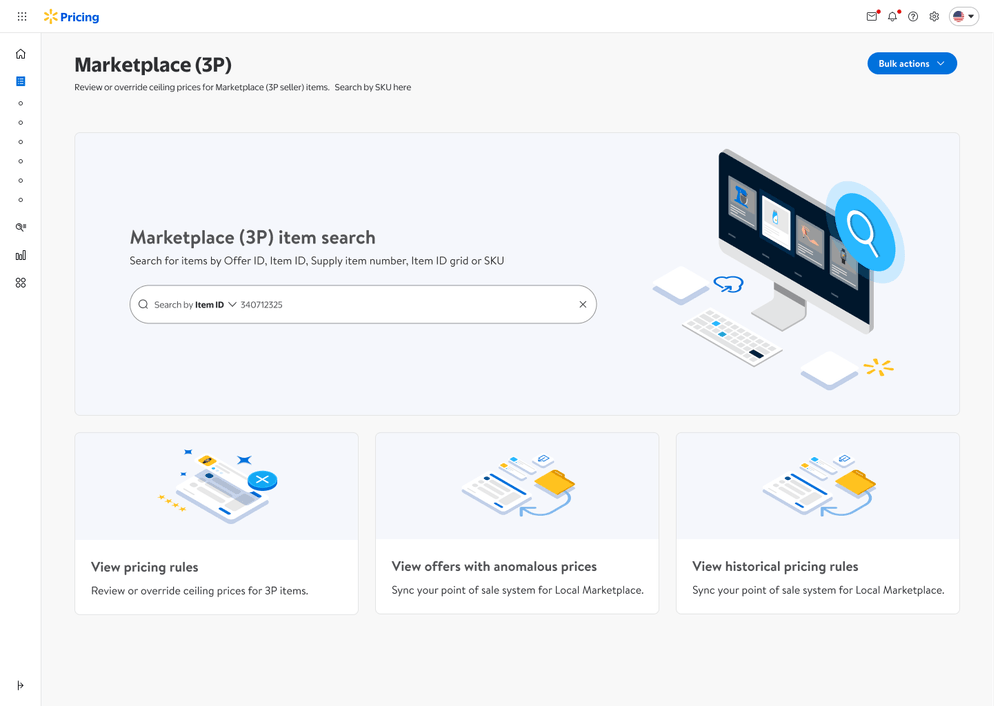
Before · After
The same job, on two screens
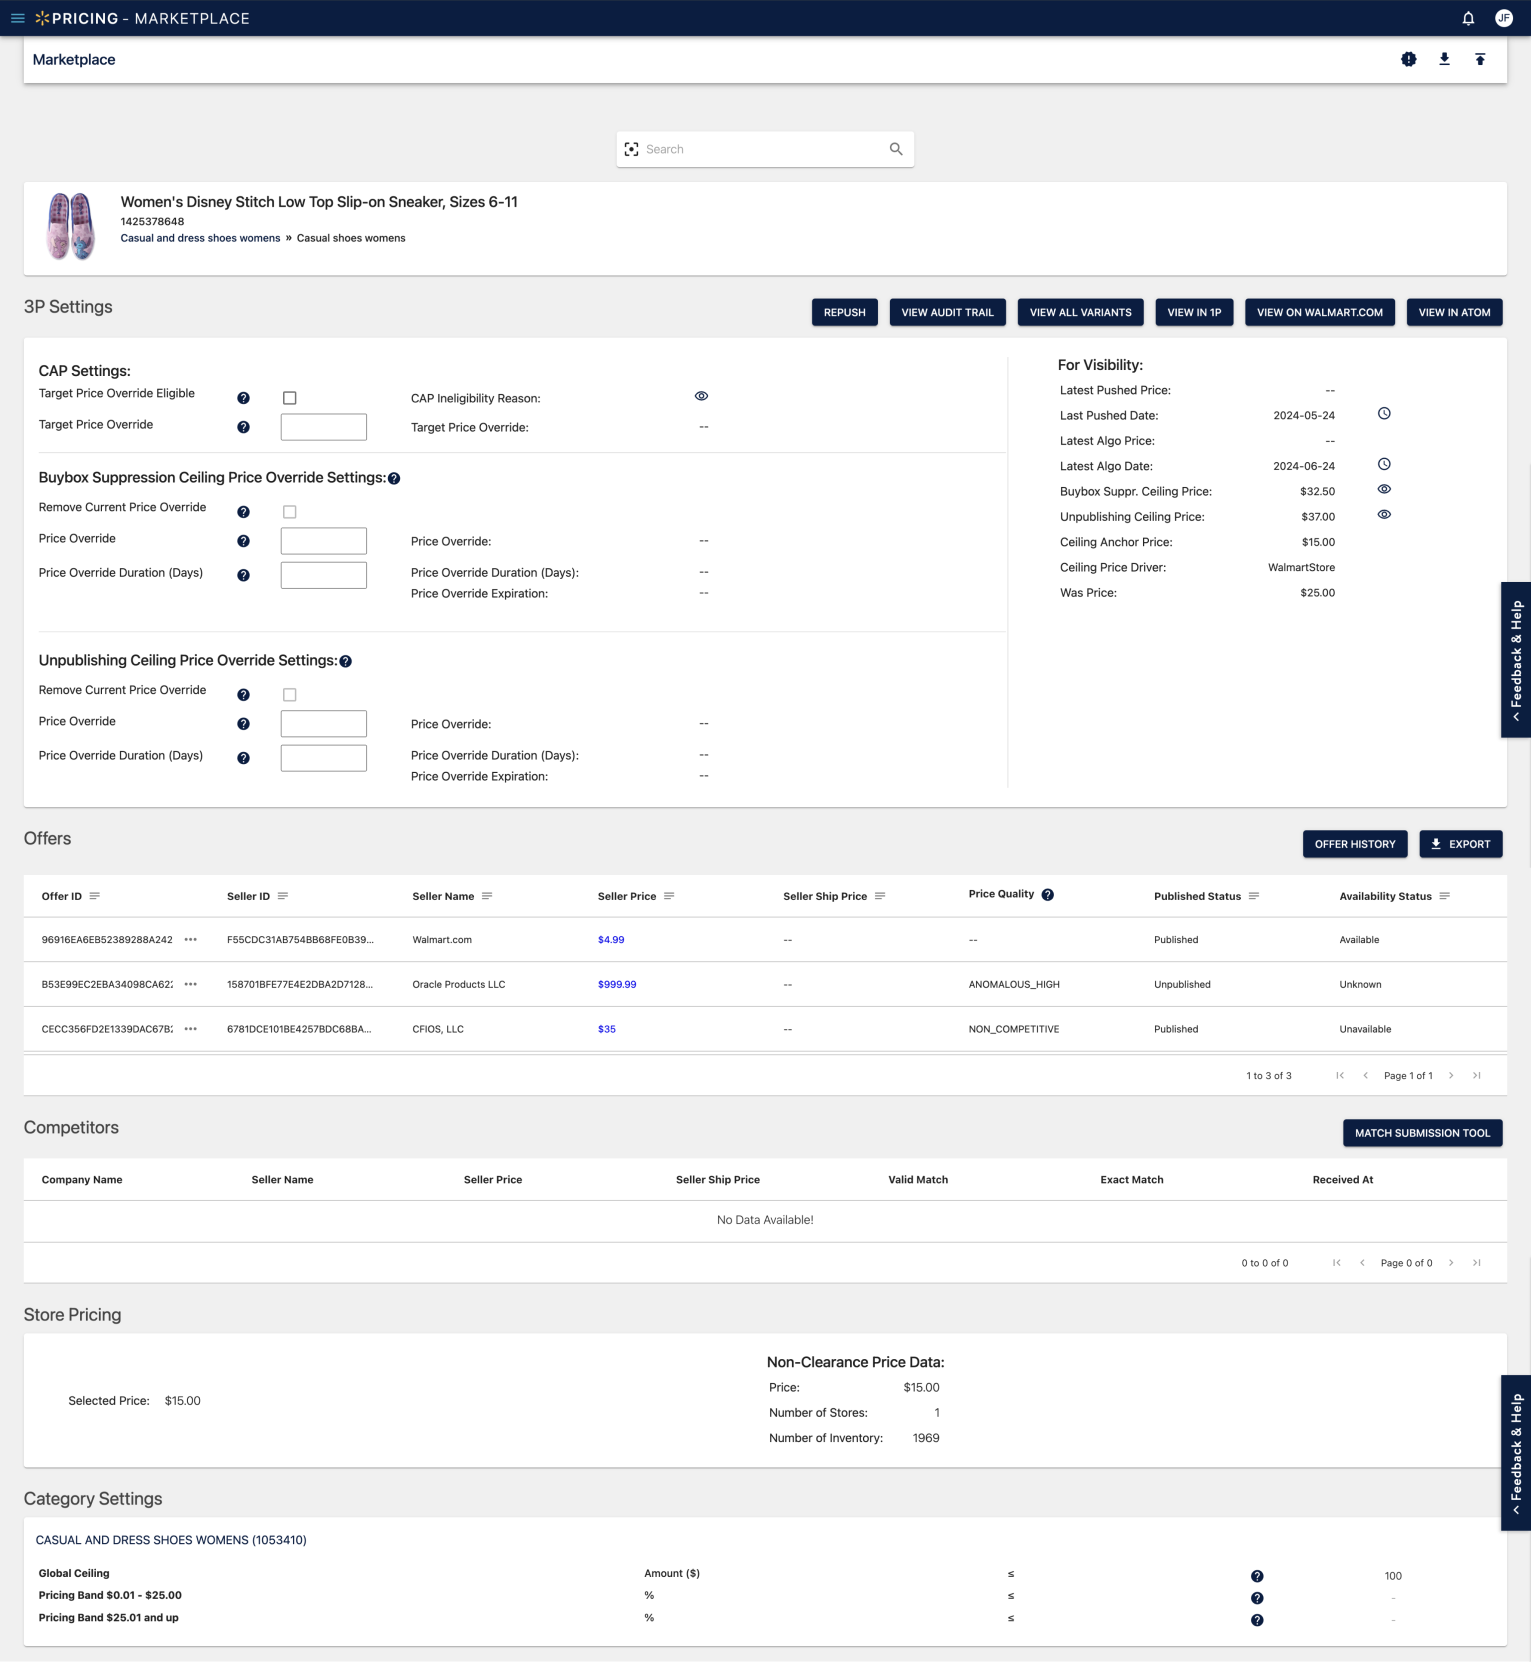
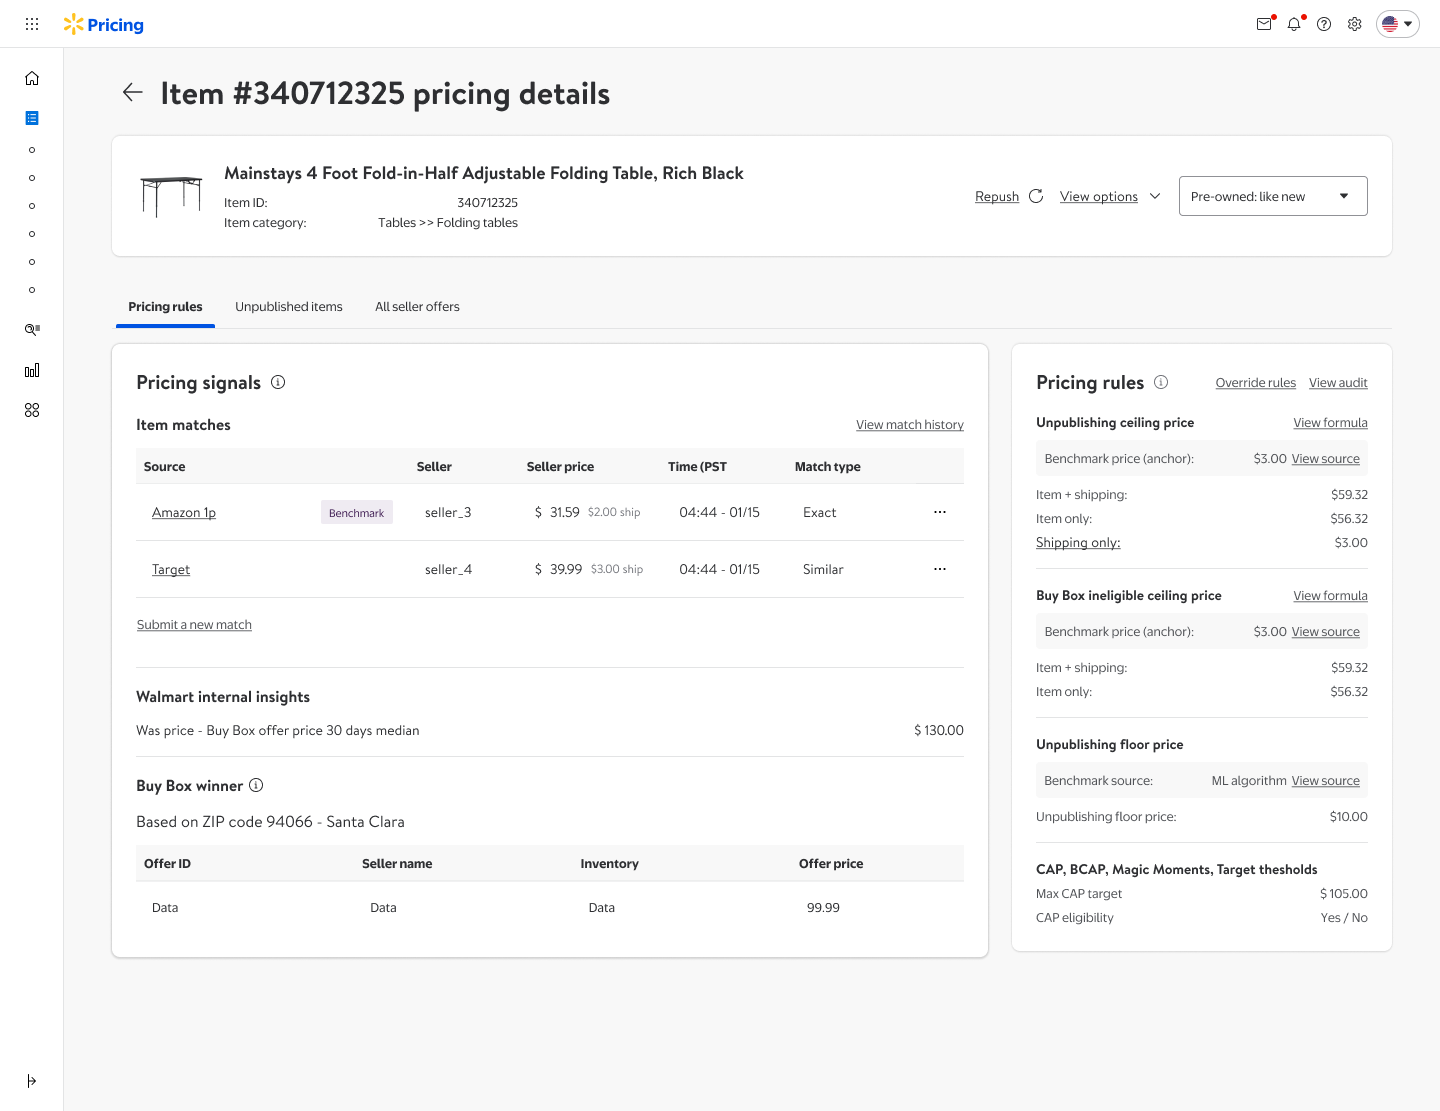
The data an analyst needed was spread across four tools, and the Pricing Room page itself put every threshold in one list, each with the same “reason for the current value” beside it. Nothing said which one had brought the item down.
Before — the old Pricing Room
After — the redesign
What changed
The reason
Before: five ceiling prices, each with the same sentence under it.
After: one line saying which rule unpublished the offer, at the top of the offer.
The numbers behind a threshold
Before: a value, with no way to see where it came from.
After: the benchmark, the anchor and “view formula” next to the number.
Changing a price
Before: empty override fields, with no idea of the effect.
After: a calculator against the benchmark, and an override that expires.
The constraint
Pricing analysts, SAMs and Partner Support were working one item at a time under time pressure, with the data spread across several tools. None of those tools were going away, the thresholds behind a price — ceiling, Buy Box, floor — were owned elsewhere, and any change had to hold at marketplace volume.
The design decision
The screen organizes an investigation: what came down and why, the seller offers, the thresholds and their sources, then the available correction. The reason, formula and source sit beside the decision they support.
Triage by severity
Offers are ordered by how badly they are off, above ceiling, below floor or Buy Box ineligible, so the worst case is at the top of the list.
Act where you decide
Rules are calculated from a competitive anchor and edited in place, with current versus proposed thresholds side by side, guardrails on the override, and a duration on it so a temporary fix cannot quietly become permanent.
How I knew
Discovery was a PRD and data review, the current journey mapped end to end, a read of real tickets, interviews with everyone in the chain, and shadowing SAMs, Partner Support and the pricing developers while they worked a case. Five things came back every time: fragmented data, rework, inconsistency between analysts, no clarity on why an item fell, and escalation as the default. The design was then reviewed continuously, in user testing, in design critiques, and with Content Design, the Design System team, PMs and engineering.
The trade-off
Explaining rules, benchmarks and available actions takes vertical space. The design balances that context with scanning and comparison; the portfolio does not establish how that balance affected different experience levels.
Outcome
- The targets, set before the work
- Bring the average time to resolve a case from 12 days down to 1, and escalations to the pricing team from 27% down to under 10%.
- What happened, three months after the MVP
- Average resolution fell from 12 to 2 days; escalations fell from 27% to 19%, measured three months after the MVP. Targets were 1 day and below 10%.
- What that means
- The project review records faster average resolution and fewer escalations. Neither target was fully reached. These are team outcomes; they do not establish a ten-day saving for every case or isolate the effect of design.
What I got wrong, and what I would do next
Four things from the project’s own retrospective. The ceiling price calculator worked, and that part of the bet paid. Why so many tickets still escalate is unexplained, and that is the thread I would pull first: the design answers “why did this fall”, and the remaining escalations are probably a different question. The Design System team should have been involved earlier; bringing them in late cost consistency I had to argue for later. And the data coverage underneath is thin. The matching algorithms do not give SAMs and Partner Support enough to work with, so the tool is sometimes explaining a number that itself deserves less confidence than it appears to have.